To find more whales, the Yankee whaling fleet moved from the Atlantic into the Pacific. In doing so, they expanded the territory known by the United States and facilitated the expansion of American state power.
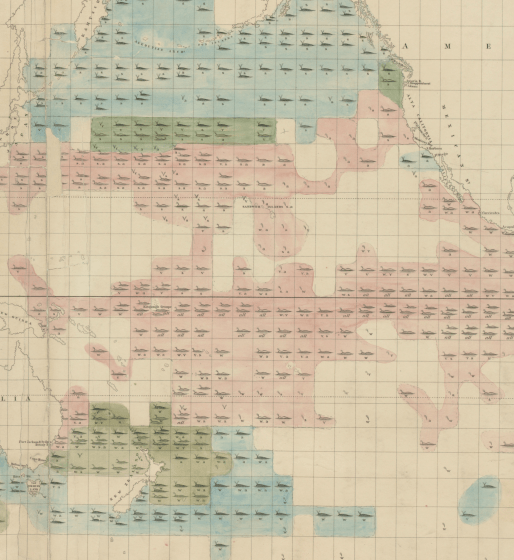
Matthew Fontaine Maury was an American naval officer who helped develop the science of oceanography. Using whaling ship logs and other data, he compiled this 1851 map of whale distribution in the Pacific Ocean. Pink whales with one spout represent Sperm Whales, particularly prized for their oil; blue whales with two spouts represent Right Whales, which supplied both oil and baleen, or whale bone. Green represents a mixture of the two kinds of whales. The best fishing season for each species is represented by letters below the whale (w for Winter; v for Spring; s for Summer; a for Autumn; all for all months).
How does Maury’s map illustrate the ways that whalers came to know the ocean? What kind of information would this provide the United States government?
Citation:
Maury, Matthew Fontaine. Whale Chart. “Norman B. Leventhal Map Center Collection, Boston Public Library.” 1851. https://collections.leventhalmap.org/search/commonwealth:x633f952x.
Library Item date:
1851