During the late 1930s, the Home Owners’ Loan Corporation (HOLC) created maps of American neighborhoods and metropolitan areas that assessed their credit-worthiness and risk. The color-coded maps were used to guide mortgage loan practices and real estate development.
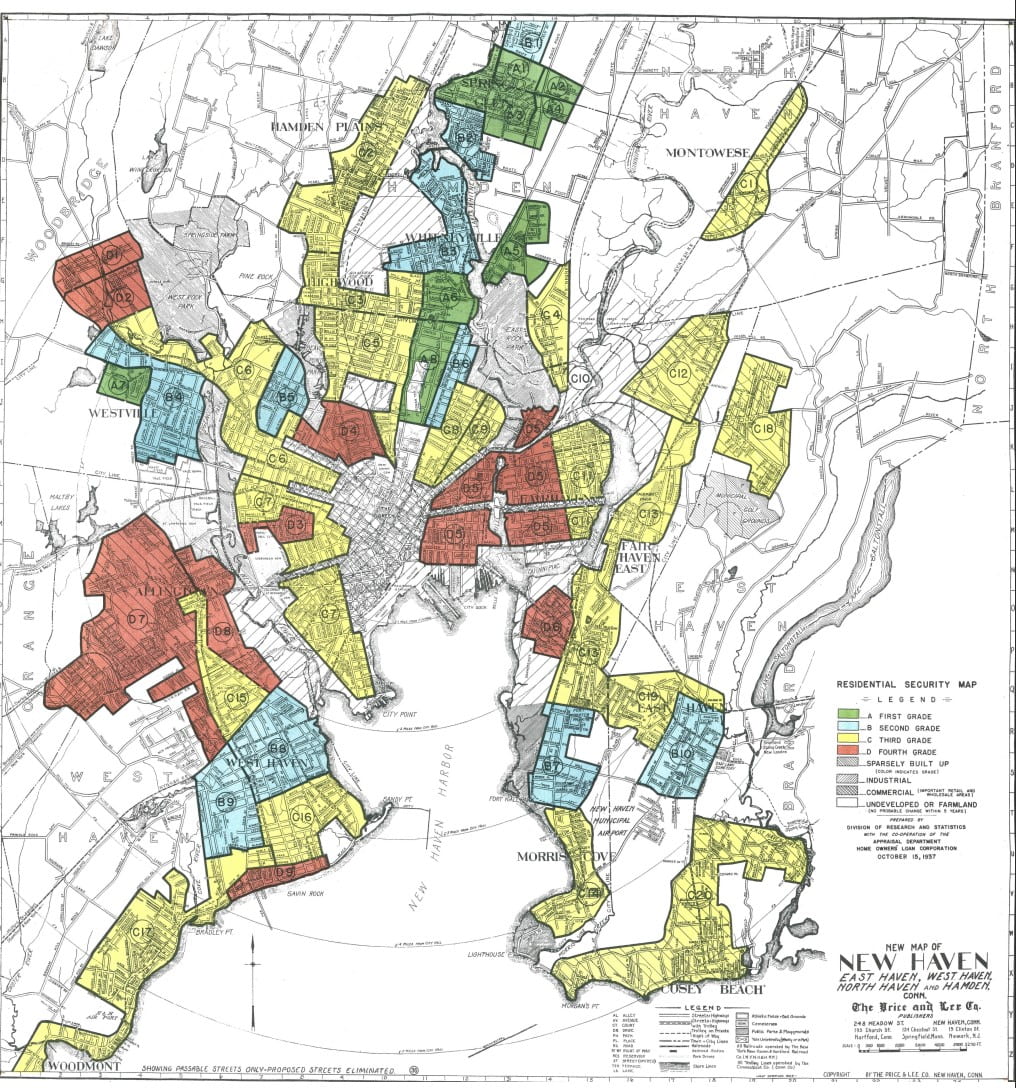
In the accompanying 1937 map of the City of New Haven, the green areas (Grade A) correspond to wealthy neighborhoods of Westville and St. Ronan’s/Edgehill, with large single-family houses or even mansions, populated predominantly by white professionals and business people. The yellow areas (Grade D) were typically smaller lots, often two or three family homes, populated predominantly by working-class African American and immigrant families.
How might the color-coding of neighborhoods have served to entrench racial inequality in urban areas?
For HOLC maps from other American cities, see, Mapping Inequality: Redlining in New Deal America
Citation:
New Map of New Haven: East Haven, West Haven, North Haven, and Hamden, Conn. Map. Mapping Inequality. 1937. https://dsl.richmond.edu/panorama/redlining.
Library Item Date:
1937